October 10, 2014
How to draw regression channel programatically
Built-in drawing tool allows to place regression channel on the chart manually and the study works on regular Close array as input. The power of AFL allows to automate this task and draw a customizable regression channel automatically in the chart or choose any custom array for calculation.
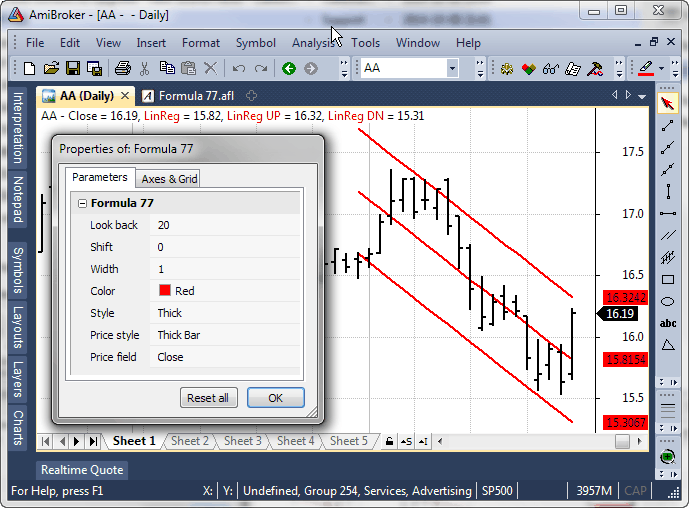
Here is a sample coding solution showing how to code Standard Deviation based channel. The Parameters dialog allows to control the array the channel is based upon, number of periods used for calculation, position and width of the channel.
lookback = Param( "Look back", 20, 1, 200, 1 );
shift = Param( "Shift", 0, 0, 20, 1 );
multiplier = Param( "Width", 1, 0.25, 5, 0.25 );
color = ParamColor( "Color", colorRed );
style = ParamStyle( "Style", styleLine | styleDots );
pricestyle = ParamStyle( "Price style", styleBar | styleThick, maskPrice );
//
// price chart
Plot( Close, "Close", colorDefault, pricestyle );
//
array = ParamField( "Price field", -1 );
//
x = BarIndex() + 1;
lastx = LastValue( x ) - shift;
//
// compute linear regression coefficients
aa = LastValue( Ref( LinRegIntercept( array, lookback ), -shift ) );
bb = LastValue( Ref( LinRegSlope( array, lookback ), -shift ) );
//
// the equation for straight line
y = Aa + bb * ( x - ( Lastx - lookback + 1 ) );
//
width = LastValue( Ref( StDev( array, lookback ), -shift ) );
//
drawit = x > ( lastx - lookback ) AND BarIndex() < Lastx;
//
// draw regression line...
Plot( IIf( drawit, y, Null ), "LinReg", color, style );
// ... and channel
Plot( IIf( drawit, y + width*multiplier , Null ), "LinReg UP", color, style );
Plot( IIf( drawit, y - width*multiplier , Null ), "LinReg DN", color, style )
Here is the picture that shows how it looks:

 Filed by Tomasz Janeczko at 7:30 am under Indicators
Comments Off on How to draw regression channel programatically