September 24, 2014
How to identify signal that triggered entry/exit if multiple signals are used
When designing a trading system we often need to quickly identify which of the rules used in the code triggered the particular Buy or Sell signal. Here are some techniques that may be useful in such identification.
For the purpose of this demonstration let us use a sample formula, where the Buy signal may be triggered by one of three independent rules:
Buy1 = Cross( MACD(), Signal() );
Buy2 = Cross( Close, MA(Close, 50) );
Buy3 = Cross( RSI(), 30 );
//
Buy = buy1 OR Buy2 OR Buy3
To determine which of those three rules generates the entry signal, we can either visualize signals in the chart or use Exploration feature of the Analysis window.
In case a custom chart is used, we can do the following:
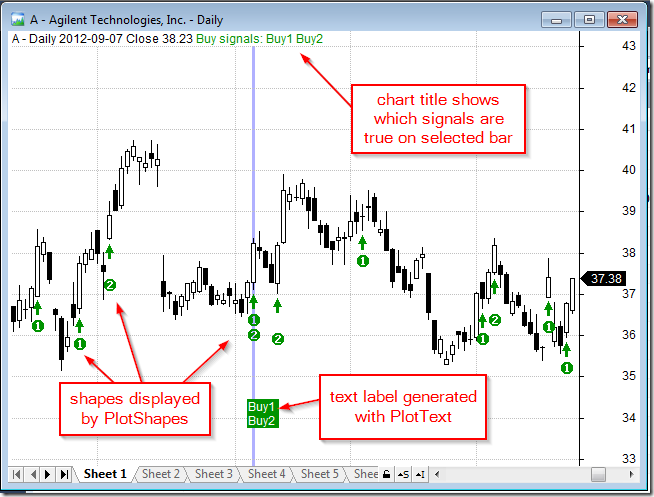
- display the signal in custom chart title
- use PlotShapes function to indicate certain buy rule
- use PlotText to add pre-defined text labels.
The formula below shows sample implementations of these three techniques. This is actually one of many ways that can be used for coding such custom output:
Buy1 = Cross( MACD(), Signal() );
Buy2 = Cross( Close, MA(Close,50) );
Buy3 = Cross( RSI(), 30 );
//
Buy = buy1 OR Buy2 OR Buy3;
//
// Standard price plot
Plot( Close, "Close", colorBlack, styleCandle);
//
// Custom title definition
BuyReason = EncodeColor(colorGreen ) + WriteIf(Buy,"Buy signals: ","")
           + WriteIf(buy1, "Buy1 ", "") +WriteIf(buy2, "Buy2", "")
           + WriteIf(buy3, "Buy3", "");
Title = StrFormat( "{{NAME}} - {{INTERVAL}} {{DATE}} Close %g ",Close ) +BuyReason;
//
// Plotshapes function calls
PlotShapes(Buy*shapeUpArrow, colorGreen, 0, Low);
PlotShapes(Buy1*shapedigit1, colorGreen, 0, Low,-30);
PlotShapes(Buy2*shapedigit2, colorGreen, 0, Low,-45);
PlotShapes(Buy3*shapedigit3, colorGreen, 0, Low,-60);
//
//
// Custom text labels displayed with PlotText
if( SelectedValue(Buy) )
{
   i = SelectedValue( BarIndex() );
   maxy = Status("axismaxy");
   miny = Status("axisminy");
   y = 0.15 * (maxy - miny) + miny;
   text = WriteIf(buy1[ i ], "\nBuy1 ", "")
          +  WriteIf(buy2[ i ], "\nBuy2 ", "")
          +  WriteIf(buy3[ i ], "\nBuy3 ", "");
   PlotText( text, i,  y, colorWhite, colorGreen );
The chart below shows how to use signal visualization technique implemented in the formula.

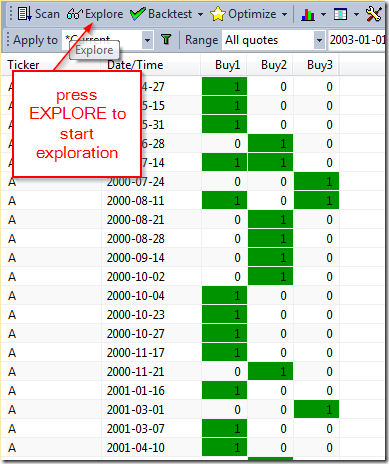
The other method is to use the Exploration feature of Analysis window that allows to generate tabular output, where we can display the values of selected variables. The detailed tutorial explaining this feature is available at:
http://www.amibroker.com/guide/h_exploration.html
For the discussed purpose of tracking the signals that triggered entry or exit, we can add the following code to our trading system to show the values of each Buy1, Buy2, Buy3 variables:
Filter = Buy;
AddColumn( Buy1, "Buy1", 1, colorDefault, IIf( Buy1, colorGreen, colorDefault ) );
AddColumn( Buy2, "Buy2", 1, colorDefault, IIf( Buy2, colorGreen, colorDefault ) );
AddColumn( Buy3, "Buy3", 1, colorDefault, IIf( Buy3, colorGreen, colorDefault ) )
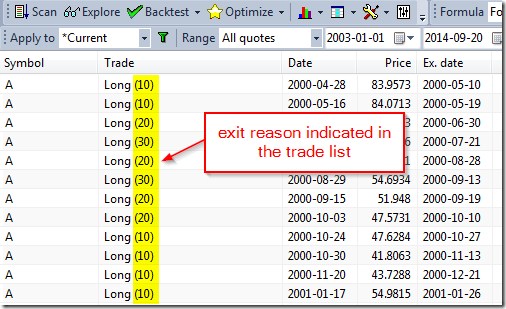
With regard to exit signals they can be visualized in a similar way as shown above, but there is also an additional functionality in the backtester, which allows to indicate the exit condition directly in the trade list. This can be done by assigning values higher than 1 (but not more than 127) to Sell variable.
Sell1 = Cross( Signal(), MACD() );
sell2 = Cross( MA(Close, 50), Close );
Sell = Sell1 * 10 + Sell2 * 20
The above expression will result in assigning value of 10 to Sell variable for the bars where Sell1 is true, 20 for the bars where Sell2 is true and 30 for the bars where both conditions are true.
These values will be indicated in the trade list:

It is worth to mention that values 1 to 9 are reserved for built-in stops and used internally by the backtester, and have special meaning:
- normal exit
- maximum loss stop
- profit target stop
- trailing stop
- n-bar stop
- ruin stop (losing 99.96% of entry value)
- reserved
- reserved
- reserved
Note also that you must not assign value greater than 127 to Sell or Cover variable. If you assign bigger value it will be truncated.
This is further discussed here: http://www.amibroker.com/guide/afl/equity.html
 Filed by Tomasz Janeczko at 12:30 pm under Backtest
Comments Off on How to identify signal that triggered entry/exit if multiple signals are used