amibroker

HomeKnowledge Base

Using per-symbol parameter values in charts

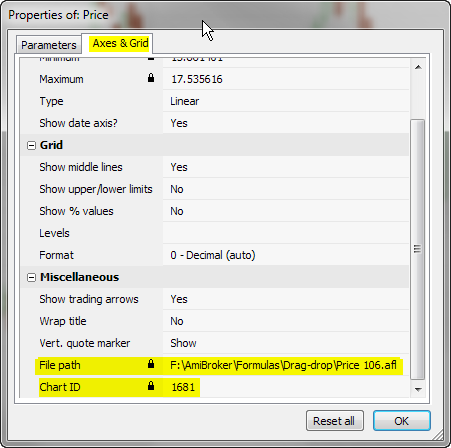
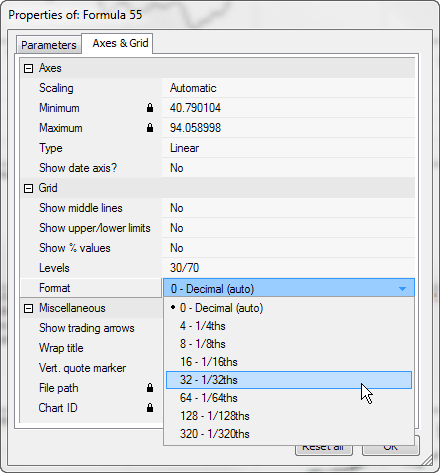
Parameter values in AmiBroker are stored separately for each ChartID. A ChartID is a number that uniquely identifies chart. This makes it possible that parameters having same name can hold different values when they are used in different charts (different ChartIDs). This also allows to share parameters if two panes use same ChartID. (A detailed explanation can be found here: http://www.amibroker.com/kb/2014/10/06/relationship-between-chart-panes/ )

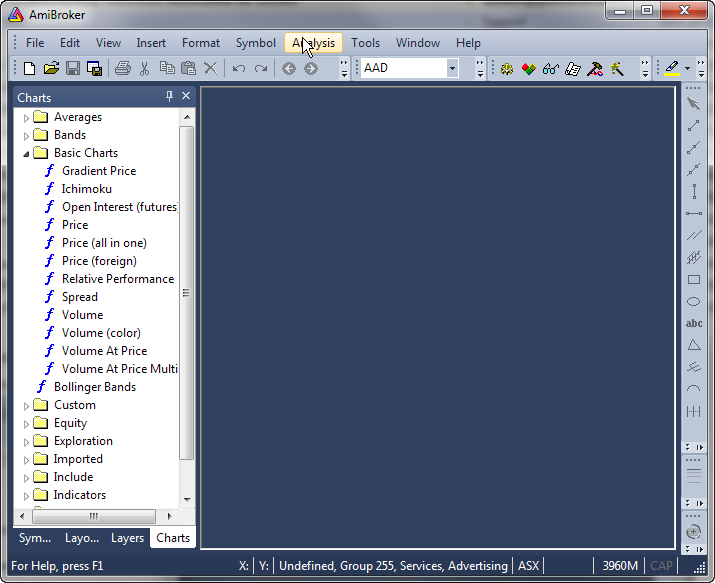
For this reason, if we want to have separate chart parameters for each symbol, we need to set up separate chart for every symbol. To do so, follow these steps:

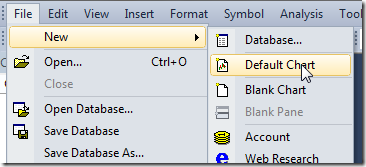
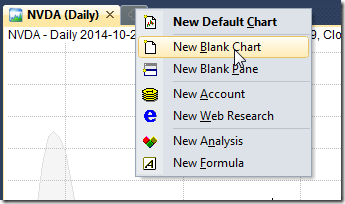
  1. create several new chart windows using File->New->Blank Chart (or choosing New Blank Chart from the menu under + button in MDI tabs area)
    New Blank Chart

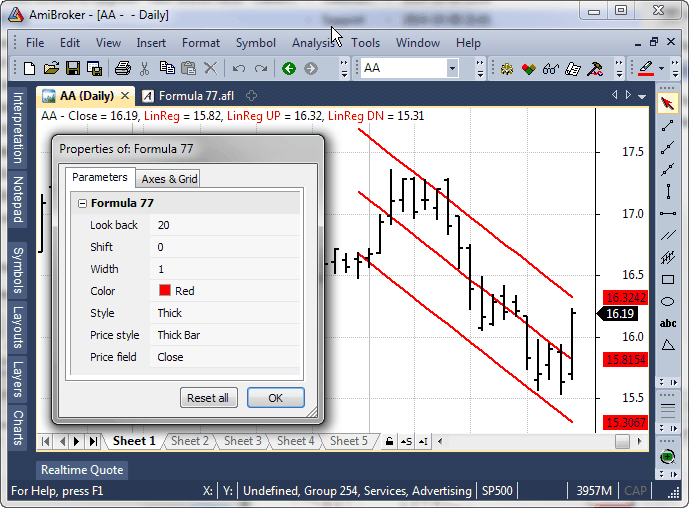
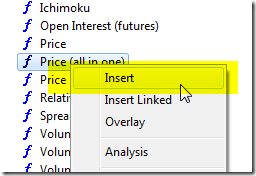
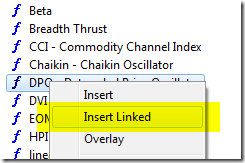
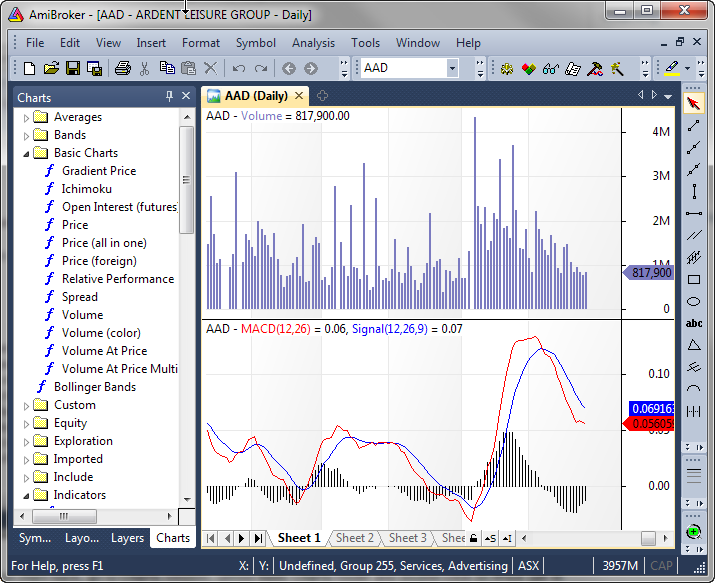
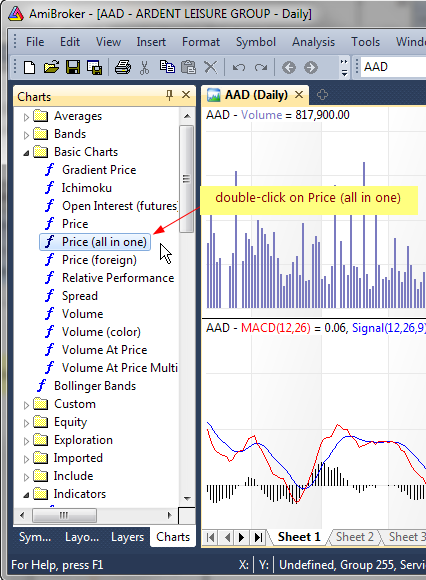
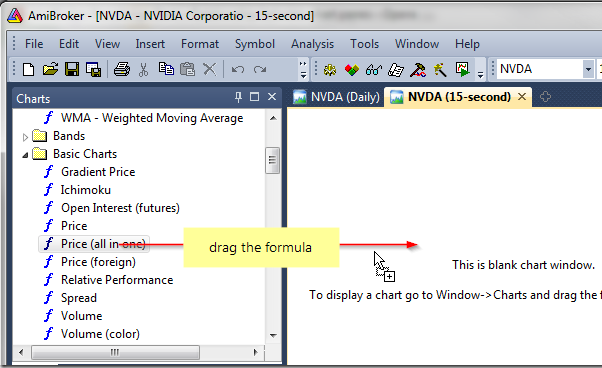
  2. drag Price( all in one) formula or any other indicators onto each of the newly opened windows
    Drag-drop chart

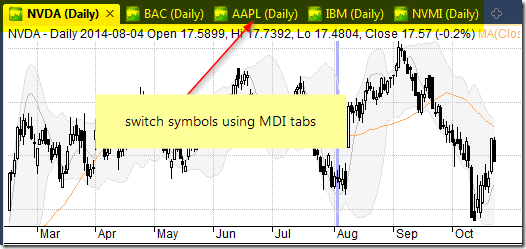
  3. select different active symbol for every chart
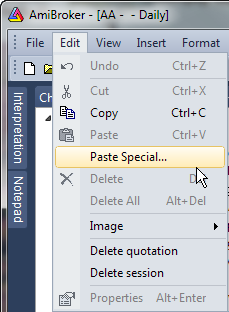
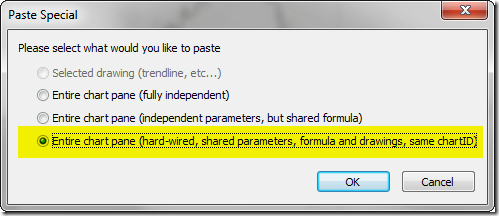
  4. define parameters individually and save the whole layout in the Layouts window

As a result – we have a setup of several chart windows, where we can quickly access given symbol showing chart with its separately stored parameters.

MDI Charts

There is also a way to handle the chart parameter values directly from the AFL formula, which would detect the active symbol and set the parameter values accordingly. Here is an example of such implementation using switch statement:
http://www.amibroker.com/guide/keyword/switch.html

To display this chart, open the Formula Editor, enter the following code and then press Apply Indicator button.

// detect the active symbol and store in n variable
Name();

// set parameter values based on the symbol name
switch ( )
{
// values for MSFT symbol
case "MSFT":
    
MA1periods 10;
    
MA2periods 21;
    break;

// values for IBM and NVDA
case "IBM":
case 
"NVDA":
    
MA1periods 30;
    
MA2periods 40;
    break;

// values for other tickers
default:
    
MA1periods 50;
    
MA2periods 100;
    break;
}

PlotClose"C"colorDefaultstyleBar );

PlotMACloseMA1periods ) , "MA(" MA1Periods ")" colorRed );
PlotMACloseMA2periods ) , "MA(" MA2Periods ")"colorBlue )

This way we can handle all individual parameter values within a single chart pane.

How to force Line chart style for specific symbols (like mutual funds)

There is an easy way to avoid switching the price chart style back and forth if we want e.g. to display a candlestick chart for our stock symbols, but a line chart for just a subset of tickers in our database (e.g. mutual funds).

To achieve that – we need to set Continuous Quotations option to No in Symbol->Information window for the symbols that have only one price fixing per day (only close price available).

Continuous Quotations

Then – if we choose View->Price Chart Style to Auto – the chart will automatically use Line style for all symbols that have Continuous quotations option set to No. Other symbols will still use Candlesticks chart style.

Automatic style

How to export chart image to a file

Charts can be exported as GIF or PNG files either manually or programmatically.

To export chart image manually, simply use Edit->Image->Export to file menu. Instead of exporting you can also copy the image to Windows clipboard (Edit->Image->Copy As Bitmap – this will copy bitmap image or Edit->Image->Copy As Metafile – this will copy vector/scalable graphic).

In order to export image in programmatic manner (from external program), you can use OLE automation interface described here http://www.amibroker.com/guide/objects.html

Below is a sample JScript code that shows how to use OLE interface from the script:

AB = new ActiveXObject("Broker.Application");
AW AB.ActiveWindow;
AW.ExportImage"C:\\example.gif"640480 ); // 640, 480 are pixel dimension

The code is intended to be used from the outside of AmiBroker.

To use above code follow these steps:

  1. Open Notepad
  2. Copy-paste above the code
  3. Save the file with .JS extension (which means that system will treat this as JScript code)
  4. Make sure that AmiBroker is running with desired chart as active one
  5. Double click on .JS file to execute the JScript code

After doing so, resulting example.gif image file can be found on C: drive.

OLE automation can also be used from any other COM/OLE-aware programs/languages.

How to draw regression channel programatically

Built-in drawing tool allows to place regression channel on the chart manually and the study works on regular Close array as input. The power of AFL allows to automate this task and draw a customizable regression channel automatically in the chart or choose any custom array for calculation.

Here is a sample coding solution showing how to code Standard Deviation based channel. The Parameters dialog allows to control the array the channel is based upon, number of periods used for calculation, position and width of the channel.

lookback Param"Look back"201200);
shift Param"Shift"0020);
multiplier Param"Width"10.2550.25 );
color ParamColor"Color"colorRed );
style ParamStyle"Style"styleLine styleDots );
pricestyle ParamStyle"Price style"styleBar styleThickmaskPrice );
//
// price chart
PlotClose"Close"colorDefaultpricestyle );
//
array = ParamField"Price field", -);
//
BarIndex() + 1;
lastx LastValue) - shift;
//
// compute linear regression coefficients
aa LastValueRefLinRegIntercept( array, lookback ), -shift ) );
bb LastValueRefLinRegSlope( array, lookback ), -shift ) );
//
// the equation for straight line
Aa bb * ( - ( Lastx lookback ) );
//
width LastValueRefStDev( array, lookback ), -shift ) );
//
drawit > ( lastx lookback ) AND BarIndex() < Lastx;
//
// draw regression line...
PlotIIfdrawityNull ), "LinReg"colorstyle );
// ... and channel
PlotIIfdrawitwidth*multiplier Null ), "LinReg UP"colorstyle );
PlotIIfdrawitwidth*multiplier Null ), "LinReg DN"colorstyle )

Here is the picture that shows how it looks:

Regression in AFL

Relationship between chart panes

In order to explain possible relationships between chart panes in AmiBroker, let us first introduce two important attributes associated with each chart pane, these are Chart ID and File path.

To see these attributes, we need to right-click on the chart and choose Parameters, then Axes&Grid tab:

Parameters window

The File path defines physical AFL file on your hard-drive that contains the indicator code used to generate charts. The Chart ID is an index to AmiBroker’s internal chart table. The chart table holds chart settings such as those seen in Axes&Grid tab, including the File path. So knowing the Chart ID, AmiBroker knows everything about the chart. The Chart ID uniquely identifies the chart.

Chart ID plays important role in the following areas:

  1. Chart parameters are keyed by Chart ID so two different charts may have same names of parameters, yet parameters are independent if those charts have different ChartID.
  2. Hand-drawn studies are stored wih Chart ID assigned to it, so they “belong” to given chart and can be referenced from other formulas using Study() function
  3. Chart IDs are stored in the layout files so AmiBroker knows which charts should be loaded when layout is loaded.

When we compare two charts, then the following relations are possible:

  1. if both Chart IDs and File paths are different, then charts are completely independent. This will happen if we use Insert option from the Charts window to create a new chart pane or when we double-click on the given formula (double-click works as Insert), because AmiBroker then would create new Chart ID and independent copy of the formula as described in manual http://www.amibroker.com/guide/h_dragdrop.html

    Insert

  2. if Chart IDs are different in both chart panes but File Path is the same, then these are different charts, yet they share same formula file. In such case hand-drawn studies will not get transferred and parameters will not be shared, but drag&drop operations and changes in the formula will affect both charts. This situation will occur if we use Insert Linked option from the Charts window to create a new chart pane directly linked to the original formula.

    Insert linked

  3. if Chart ID is the same for both – then it is essentially the very same chart. It means that all the hand-drawn studies and parameters are common for both charts (changes in one chart pane will affect the other) and all the drag&drop operations or formula changes affect both charts – that is because as a result of dragging and dropping indicators the underlying code is being modified (new sections are added). Such relationship between chart panes will happen when we open another chart window that uses the same chart template as the previous window (e.g. using File->New->Default Chart) or save chart template and load it from the other window.

There is also a functionality in AmiBroker, which allows to copy-paste the selected chart pane and define which elements are pasted. To do that click on the pane you want to copy, choose Edit->Copy from the menu, then switch to the place where you want to paste it and choose Edit->Paste Special

Paste Special

Choosing first option creates new Chart ID, and creates a copy of formula, so resulted chart is independent from source chart. Choosing second option creates new Chart ID, but links it to same formula as original, so the formula is shared. Choosing third option inserts a pane that uses same Chart ID (identical chart, everything shared).

Paste Special window

How to restore accidentially deleted price chart

When working with chart windows it sometimes may happen that we mistakenly close the chart we meant to keep displayed. Here are some suggestions showing how to quickly restore our working setup.

First situation happens when when we closed all chart windows and AmiBroker shows just an empty application window, what looks like this:

Empty chart space

In such situation the best way is to use File–>New–>Default Chart menu command, as a result will display a new chart window, which contains charts stored in default template.

Re-open default chart

Second situation is when we closed just the Price chart pane, so only indicators would remain in the chart window, looking like this:

No price pane

In order to bring the Price chart back, go to Charts window, unfold Basic Charts folder and double-click on Price (all in one) (if you want to get price chart with moving average and Bollinger bands overlays), or double-click Price (if you want to get price chart alone).

Insert price chart

It will be located at the bottom, below the other charts, but we can move it up to the top if we right-click on the chart, then choose Pane->Move Up from the context menu.

It is worth noting that AmiBroker allows to create multiple chart setups stored in Layouts, so if we have already created several layouts before, it is also possible to re-load one of the layouts from the Layouts window to restore the whole saved chart setup. This functionality is discussed in details in the following tutorial chapter: http://www.amibroker.com/guide/h_sheets.html

Why can’t I change the symbol? (Symbol lock)

If you can not change the active symbol for the chart, chances are that you have accidentally clicked “Symbol Lock” icon (a small padlock) located near the scroll bar.

Symbol Lock

When it is activated (yellow) then AmiBroker will prevent any symbol changes for active chart window. To toggle lock simply press the padlock icon.

How to display Range Bars

The Range Bars are price-driven bars, with each bar having a required minimum high-low range. Source data are consolidated into one bar until the range requirement is reached, then a new bar is started.

AmiBroker fully supports range-bar type of charting and the bar size is based on the TickSize of given symbol. This allows to define symbol-specific tick sizes individually, them display a chart which for example shows 10R bars (meaning bars using a range of 10-ticks for each symbol respectively).

To display range charts, first you need to specify the TickSize in the Symbol–>Information window.

Information window

This can be done manually as shown above, however in case of larger group of symbols it is also possible to use ASCII Importer for this purpose (more details about ASCII imports can be found here: http://www.amibroker.com/guide/d_ascii.html).

Once TickSize has been defined, then in order to display chosen range chart, the easiest way is to use Interval box in the toolbar and just type-in the desired bar size. For example, to select the range bar of 10-ticks, one can type-in 10R in the toolbar:

Range bar selection

Custom range intervals can also be defined in Tools–>Preferences, Intraday tab:

Preferences window

Then the pre-defined interval can be selected from View->Intraday menu.

It is worth noting that for best results, your database should use Tick as Base Time Interval, as then each trade is represented by an individual record in the database and can be consistently compressed to range bars. Using higher-interval data (such as 1-minute) may produce bars that are not perfect, especially if 1-minute bar high-low difference is comparable with selected range.

How to display Bond and Bill prices in fractions

Treasury Bond and Bill futures are traded in fractions, not decimals. A typical bond quote may be 124’21 which means 124 and 21/32nds, so one needs special method to display prices in non-decimal format.

To achieve desired result we need to do two things.

1. Switch Y axis grid to desired fraction format. To make a change, right click on the chart and select Parameters, then switch to Axes & Grid tab and change Grid Format as shown below:

Parameter Window

2. Create a price chart with custom title showing fractions instead of decimals. Go to Analysis->Formula Editor, enter the following formula and press Apply Indicator toolbar button.

function NumToFracnum )
{
  return 
StrFormat("%.0f'%0.f"floornum ), fracnum ) * 320 );
}
PlotClose"Close"colorDefaultstyleCandle);
Title "{{NAME}} - {{INTERVAL}} {{DATE}} Close: " NumToFracClose )

The NumToFrac function formats decimal value into full points and 1/320nds fraction of the full point.

Study() function in logarithmic scale

IMPORTANT: This article applies ONLY to AmiBroker version 5.24 and earlier. Version 5.25 includes native support for log scale in Study() function and this workaround is no longer needed.

Some of you may have tried using Study() function in logarithmic scale charts and noticed that the output of Study() function becomes curved line (not straight) as soon as logarithmic scale is used.

Before giving you solution, I would like to state some obvious things:
A straight line in log scale is NOT straight line in linear scale and vice versa. Trendlines drawn in log scale do NOT cross at the same points (except beginning and ending) as same trendline drawn in linear scale. This is pretty much the same in all charting programs.

As for the Study() function – it always uses LINEAR equation y = a*x + b regardless of particular chart scale. So, Study() always produces straight line in the linear price domain, so “a” coefficient is constant and represents the slope in price terms (dollar per bar)

This is done so, because Automatic Analysis does not have a concept of “scale” (linear vs logarithmic), therefore if Study() function was dependent on given pane setting it would not produce the same result, if the same formula was used in automatic analysis.

If you want to have “straight” line in the logarithmic price domain you need to convert to log domain in the formula, as shown in the code below


function StudyInLogScaleStudyidChartid )
{
  if( 
Version() < 5.25 )
  {
   
SetBarsRequiredsbrAllsbrAll );

   
temp StudyStudyidChartid );

   
bi BarIndex();

   
beg LastValueValueWhenExRemtemp), bi ) ); 
   
end LastValueValueWhentempbi ) );

   
result Null;
 
   if( 
beg BarCount AND end BarCount )
   {
    
begval tempbeg ];
    
endval tempend ];
    
factor endval/begval;

    for( 
beg<= endi++ )
    {
      
result] = begval factor ^ ( ( beg )/( end beg ) ); 
    }
   }
  }
  else
  {
    
result StudyStudyidChartid );
  }

  return 
result;        
}

logscale ParamToggle("Log Scale""Off|On");

SetChartOptionsIIflogScale2), chartLogarithmic );

PlotC"Price"colorBlackstyleCandle );

if( 
logscale AND Version() <= 5.24 )
{
 
ss StudyInLogScale("RE"GetChartID() );
}
else
{
 
ss Study("RE"GetChartID() );
}

Plotss"Study"colorRed )
« Previous PageNext Page »