amibroker

HomeKnowledge Base

Timestamps explained

When AmiBroker is fed with the data, say 1-minute data, it can create all other time intervals by compressing source data on-the-fly. So if you display say 13-minute chart, AmiBroker takes source 1-minute data and builds 13-minute blocks of data to create 13-minute bars. For this process to work correctly, source data need to have timestamps that point to the START of each bar interval. So with 1-minute data, the bar that has a timestamp 9:30:00 is supposed to cover trades from the period of 9:30:00.000 upto 9:30:59.999. All our data plugins provide data in that format.

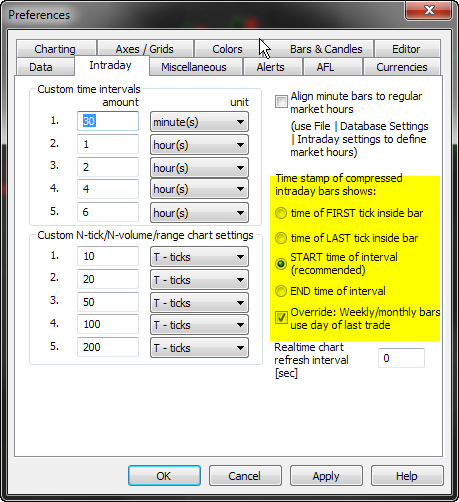
Now, provided that we have say 1-minute data, AmiBroker can compress data to any other N-minute interval. When doing so, it can assign timestamps to compressed bars in different ways. This can be controlled through Tools->Preferences->Intraday dialog.
Timestamps

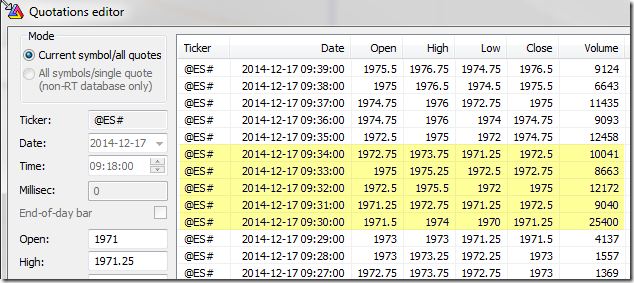
Let us check it on an example of a 5-minute bar based on input 1-minute quotes for e-mini contract.
Timestamps

As explained in the manual (http://www.amibroker.com/guide/w_preferences.html) – there are four choices available:

  1. Time of FIRST tick inside bar – when selected the bar gets the time stamp of the very first trade inside given time slot (bar). With this choice the bar will be stamped with 9:30:00 because this is the first tick (quote) available within that 5-min period
  2. Time of the LAST tick inside bar – when selected the bar gets the time stamp of the very last trade inside given time slot (bar). In this case the bar will be stamped with 9:34:00 because this is the last quote available within that 5-min period
  3. START time of the interval – when selected the bar is time-stamped with start time of the time slot (bar). The bar will be stamped with 9:30:00 because that is a beginning of the selected time period.
    NOTE: This is recommended and the default setting as it provides consistency with how source bars are timestamped. It should not be changed unless you have really good reason to do so.

  4. END time of the interval – when selected the bar is time-stamped with start time of the time slot (bar). The bar will be stamped with 9:34:59 timestamp, because that’s the very end of this 5-min period.

There is also an additional setting available (Override: Weekly/monthly bars use day of last trade), which allow to modify the behaviour in case of Weekly/Monhtly bars, no matter what is the main setting we use. This allows us to e.g. use START time of interval to identify intraday quotes, however – on a weekly chart display e.g. Wednesday date (if that is most recent day in current week) or Friday date for complete weeks.

We need to remember that the timestamps identify the whole bar and all trades within that bar, so if we use START time of interval for time-stamping, in the backtest use Close array for as BuyPrice and 5-minute periodicity, then in our report we will see:

Timestamps

So, we see the time 9:30:00, but this bar refers to trading activity from period 9:30:00-9:34:59 and the actual price is read from the tick being the Close of the whole 5-minute period (at 9:34:00 in the table above).

For the same reason – when we use weekly data for backtesting, we trade at Open, but for time-stamps we use Override box (so weekly bars are stamped with the data of the last day within given week) – then in the report we will see e.g. Friday dates because of the fact that we use such approach to time-stamp bars. This does not really mean that trade happened on Friday, but only that we use Friday date to identify the whole Monday-to-Friday week.

How to display interest gains in the backtest report

The default backtest report shows total Net Profit figure, which includes both trading profits and interest earnings. With Custom Backtest procedure we can easily isolate these components by summing up profits and loses from individual trades, then subtracting trading gains from the Net Profit and report them as separate metrics.

SetCustomBacktestProc"" );

if ( 
Status"action" ) == actionPortfolio )
{
    
bo GetBacktesterObject();
    
bo.Backtest(); // run default backtest procedure

    // read Net Profit, Winners and Losers profits from the report
    
st bo.GetPerformanceStats);
    
netProfit st.GetValue"NetProfit" );
    
tradeProfits st.GetValue("WinnersTotalProfit") + st.GetValue("LosersTotalLoss");

    
bo.AddCustomMetric"Trading profits"tradeProfits );
    
bo.AddCustomMetric"Interest earnings"netProfit tradeProfits );

}

// trading rules here
Buy CrossMACD(), Signal() );
Sell CrossSignal(), MACD() )

After backtest is run, we can see our custom metrics in the backtest report.

More information about creating custom metrics can be found in the manual:
http://www.amibroker.com/guide/a_custommetrics.html

FastTrack data configuration and troubleshooting

General configuration process for FastTrack datasource is explained in the manual:
http://www.amibroker.com/guide/h_extsources.html

Sometimes however, after the configuration process the FastTrack data source is still missing from the list of sources in File->Database Settings. If that happens, please follow the steps listed below to make this source available:

First you need to make sure that you are using 32-bit version of AmiBroker as FastTrack is 32-bit application and only the other 32-bit application can use its data via their API. To check what version of AmiBroker you have go to Help->About window. If you do not have proper version, please download 32-bit one from http://www.amibroker.com/download.html

Secondly you need to install FastTrack for the Web (FT4Web) program. If you are using Windows Vista, Windows 7 or Windows 8, it is good idea to first turn OFF User Access Control (down to “Never notify”). The following video shows the process:
http://windows.microsoft.com/en-US/windows7/Turn-User-Account-Control-on-or-off. Then install FastTrack for the web (FT4Web) program.

If the FastTrack datasource is still missing from the data source combo in Database Settings, then it is necessary to check if:

  1. FT.DLL is inside “AmiBroker/Plugins” folder
  2. FastTrack.DLL file is installed by FT4Web inside Windows folder

If it can not be found in the Windows folder, we need to make sure that FastTrack for the web is installed, then perform a search for FastTrack.DLL file using Windows Explorer file search.

Once the FastTrack.DLL file is found, we need to copy it to AmiBroker main folder – then FastTrack datasource should then become available in AmiBroker.

Using optimum parameter values in backtesting

After Optimization process has found optimum values for parameters of our trading system, typically we want to use optimum values in subsequent backtesting or explorations. In order to achieve that, we need to manually update default_val (second) argument of Optimize function with the values obtained from the optimization report.

The arguments of Optimize function are shown below (note second parameter marked in dark red color – this is the default value parameter we will be changing after optimization run):

some_var = Optimize( "description", default_val, min_val , max_val, step );

Let us consider the following example formula used for optimization process:

SetOption("ExtraColumnsLocation"1);
periods Optimize"Periods"2550); // note that default value is 2
Level Optimize"Level"22150); // note that default value is 2

Buy CrossCCIperiods ), -Level );
Sell CrossLevelCCIperiods ) )

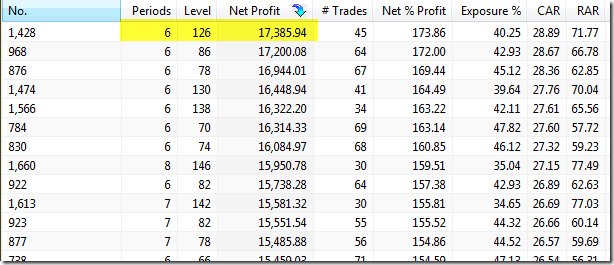
If we perform Optimization process and check the results (for this example we use Net Profit as the optimization target), we can see that the best results use Periods = 6 and Level = 126.

Optimization result

Now in order to run backtest and obtain exactly the same results as in the respective line of the above Optimization results, we need to enter the values into default argument, so the modified code will look like this:

SetOption("ExtraColumnsLocation"1);
periods Optimize"Periods"6550); // we changed default value to 6
Level Optimize"Level"1262150); // we changed default value to 126

Buy CrossCCIperiods ), -Level );
Sell CrossLevelCCIperiods ) )

Now we can use the code with modes other than Optimization and the formula will use optimized values we retrieved from the results.

« Previous Page