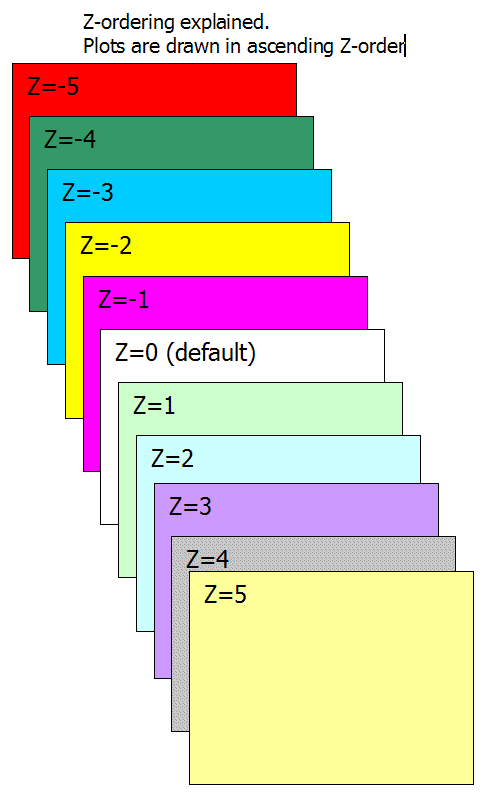
See this picture:

Introduction
What Z-order is?
Imagine that you could see the drawing objects arranged on the chart page like
puzzle pieces on a table. Some objects may appear to be placed one on top
of another, and others may be overlapping.
This third dimension of chart page is known as "Z order." If the
X axis relates to width and the Y axis to height, then the Z order relates
to depth. Although Z order cannot be seen directly, just as can you position
objects along X and Y (horizontal and vertical) axes, you can also position
them in the Z order.
Every object on the page has its Z order, positioned in back to front order,
so that objects at the front will take precedence over objects behind.
Z order gives you the ability to superimpose objects one on top of another.
Usage
Z-order is a parameter which defines the Z-axis position of given plot /
drawing.
Z-order parameter can be passed to Plot(), PlotOHLC() and PlotForeign() AFL functions and can be set from the user interface for any manual drawing tool.
You can change Z-order parameter for drawing tools using Properties dialog as well as using Format->Z-Order->Bring Forward / Send Backward menus (and default keystrokes Shift+Page Up, Shift+Page Down).
The default is z-order value is zero. Zorder = 0 means also where the "grid" is located. So if you want to plot BEHIND the grid you need to specify negative zorder parameter. Smaller values mean draw first (i.e. BEHIND others), higher values mean draw later (ON TOP of others).
Plots are drawn in the following order:

Please note
the above applies to each zorder "layer" separately (so
within same zorder "layer" reverse call rule applies)
Example (Bollinger bands with "cloud" fill behind price (zorder
= -1)):
P = ParamField("Price
        field",-1);

        Periods = Param("Periods", 15, 2, 100, 1 );

        Width = Param("Width", 2, 0, 10, 0.05 );

        Color = ParamColor("Color", colorLightGrey );

        Style = ParamStyle("Style")
        | styleNoRescale;;

        Plot( bbt = BBandTop(
        P, Periods, Width ), "BBTop" + _PARAM_VALUES(),
        Color, Style );

        Plot( bbb = BBandBot(
        P, Periods, Width ), "BBBot" + _PARAM_VALUES(),
        Color, Style );

        PlotOHLC( bbt,
        bbt, bbb, bbb, "", ColorBlend(
        Color, colorWhite, 0.9 ), styleCloud, Null, Null, Null,
        -1 );