Issue 3/2000
Issue 3/2000.
Copyright (C)2000 Tomasz Janeczko.
All back issues available from:
http://www.amibroker.com/newsletter/
|
Issue 3/2000 |
AmiBroker Tips weekly newsletter. Issue 3/2000. Copyright (C)2000 Tomasz Janeczko. All back issues available from: http://www.amibroker.com/newsletter/ |
Welcome to the 3rd issue of AmiBroker Tips newsletter. In this issue a new regular column will start: "Tutorial". This column is intended for novice users to learn about basic AmiBroker's functionality. This column will be also the basis of a complete tutorial that will be released next year.
In AFL corner I will discuss two methods of plotting volatility graphs. Please
remember that all formulas presented in this column will also appear in http://www.amibroker.com/library.html
By the way: Do you find this newsletter useful? Have any comments/suggestions or article ideas. Please don't hesitate to drop a line to newsletter@amibroker.com
AmiBroker allows the user to define his/her own indicators written in flexible AFL (AmiBroker Formula Language). You can find the description of this language in AFL Reference Guide section of user's guide. Here I will present basic steps needed to define and display your own custom indicator. In this example we will define an "indicator" that will show line volume graph (opposite to built-in bar volume graph).
Just follow these steps


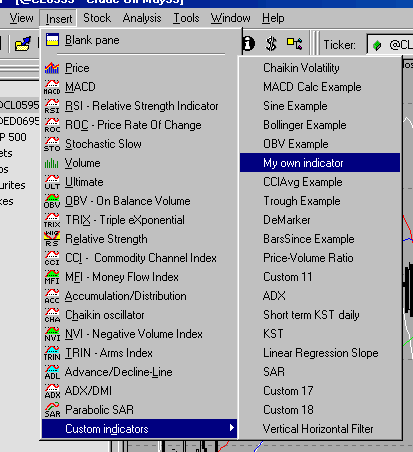
Now you are ready to use your first custom indicator - please select menu Insert->Custom
Indicators->My own indicator as shown in the picture below:

A new chart pane will be displayed showing volume line chart.
For further reference on using Indicator Builder please consult Environment - Indicator Builder and AmiBroker Formula Language - AFL Tools sections of AmiBroker User's guide.
Volatility is a general term used to describe the magnitude of day-to-day fluctuations in prices (independent of direction). Generally, changes in volatility tend to lead changes in prices. There are several ways to measure the volatility. In this issue I will describe the formulas that use two, probably the simplest, approaches to this task.
Average True Range
The True Range indicator is defined by Wilder to be the greatest of the following
for each period:
The Average True Range is simply the average of the true ranges over the past n periods. AmiBroker has built in AFL function for that purpose - atr( periods ). You can use simple 14 day ATR as a volatility indicator using the following formula:
graph0 = atr( 14 );
Alternatively, you can add some more smoothing using the following formula:
graph0 = ema( atr( 14 ) , 5 );
Since atr() itself uses moving average in its construction the latter formula uses in fact double smoothing and exhibits more delay than the first formula.
For both formulas high readings of the indicator mean high market volatility while low readings mean low volatility.
Chaikin's Volatility
Marc Chaikin uses different approach to measure volatility. His volatility indicator compares the spread between a security's high and low prices. This is done by first calculating a moving average of the difference between the daily high and low prices and then calculating the rate of change of that moving average. Marc Chaikin recommends 10-periods for both the moving average and the rate of change. The AFL formula for Chaikin's volatility is:
graph0 = roc( ema( high-low, 10), 10);
4 Tip of the week: Adding your own import formats
Note: This functionality is available only in Windows version of AmiBroker
AmiBroker can use not only default.format definition file but also other user-specified
files. File types, filters and format definition files are specified in import.types
file, located in AmiBroker's main directory.
If such file exists you will see your types in the "Files of type" combo-box
of ASCII importer file dialog and when you select one - appropriate filter will
be used and after selecting some files and clicking OK - importer will use specified
".format" file. In that way you can define as many text-based data formats as
you like and AmiBroker will be able to "understand" them all.
The user can prepare/modify import.types file with the description of supported ASCII formats and filters to use. The file could be edited in any plain text editor such as Notepad.
The format of import.types file is:
<Descriptive name>|<File
    filter>|<definition file name>
Default ASCII (*.*)|*.*|default.format

    Yahoo's CSV (*.csv)|*.csv|yahoo.format

    Metastock ASCII (*.mst)|*.mst|metastock.format

    Omega SC ASCII (*.txt)|*.txt|omega.format

    S-Files (s*.*)|s*.*|sfile.format

    C-Files (c*.*)|c*.*|cfile.format

    Sharenet DAT (*.dat)|*.dat|dat.format
In order to add you own import format you will need to:
My own format (*.*)|*.*|myown.formatAfter saving the files please launch AmiBroker and open ASCII file import dialog - you should see your own type shown in "Files of type" combo box.
.... and that's all for this week - hope you enjoyed readingAmiBroker Tips weekly newsletter. Issue 3/2000. Copyright (C)2000 Tomasz Janeczko. All back issues available from: http://www.amibroker.com/newsletter/